

rakish
-
Posts
1,470 -
Joined
-
Last visited
Content Type
Profiles
Forums
Events
Everything posted by rakish
-
They flipped 2017 and 2019, and bad math for 2018. So yes, completely wrong. I looked at the CBA deal memo, what I get is 17m in 2017, 11m in 2018, and 5.6 in 2019.
-

NYR fire John Tortorella, Hire Alain Vigneault as new HC
rakish replied to 26CornerBlitz's topic in Archive
Thanks, Yeah, it's ruby code scraping the RTSS reports. If you are inclined yourself, I'll put more code up on github I disagree with you on Lundqvist. If you look at the small numbers in the legend, what this chart is trying to do is to estimate the number of goals Lundqvist would have given up as an average goaltender. From the distance he saw shots from, his save % should have been .09, it was .074 (you got to 1- to get a number you normally see, .91, and .926 ), and that saved the Rangers about 20 goals (Bobrovsky led the league at about 23, as I mention in the Miller thread, Miller was +5, Enroth -1) -
NYR fire John Tortorella, Hire Alain Vigneault as new HC
rakish replied to 26CornerBlitz's topic in Archive
Watching hockey, I've always thought the same thing about the deflection, but I can't really find confirmation looking at charts. This one of Lundqvist shows that the Rangers defensively (the red line) are excellent at limiting close in shots. On the offensive zone (the green line), they get a higher percentage of, say, 9' shots that their opponents. It also shows up on where goals happen, with the green dots fill up fast close in. (I got tired of making little dots at 5, I just wanted to see what the spread looks like) Marty's chart looks similar.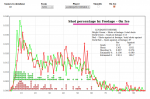
-
Isn't Ehrhoff's contract structured similar to Richards'? but at 66% of the money.
-
I've been working on goaltending stats. I separated the number of goals by distance, calculated the average shooting percentage by footage, found the number of goals he should have given up for that distance, subtracted the number of goals he did give up at that distance, then totaled each distance. This year Bobrovsky saved the most goals, at about 21, Lundqvist and Howard were at about 20. Miller at 5, Enroth at -1. For me, the interesting thing was charting against capnumber. Everyone, except for Lundqvist (if you don't count Howard), that made big money, was a disappointment. Miller and Fleury were OK, but Ward, Quck, Rinne, Bryz, Backstrom, and Luongo were all negative. As far as percentage, Anderson was the best for full time goalies, saving about 18 but in fewer games. It's not the best stat ever, since a goaltender that gives up a lot of rebounds will have a lower expected save percentage, thus will benefit from his own mistake.
-
To answer your question X, I believe that good organizations find the way win games. So no to Regier's new premise. I've been working on some charts the past while. One of them separates team plus/minus by even strength, PP, and PK. Look at the Columbus chart. They traded Nash and Carter (or was it the other one) , game 22 they got their even strength play together. They won with talent like Bob in goal. Now they have 3 first round picks and a team that's got to be dying to get back on the ice.
-
I try to think like the protagonists for this sort of question. I believe Pegula is a solutions guy. The narrative last offseason was that defensemen got hurt, Miller got run, and they played too many backs to back. The solution was to sign 9 defensemen, signed John Scott, stopped playing Friday Night (if I remember right). This year I can't think of a serious narrative that involves Miller. I believe Regier is a value guy. He shopped Miller at the deadline, not enough. I think there will be much less offered in the offseason. He also feels burned by Drury and the other one, so he won't let him go to free agency. My prediction, 2 more years offered at 13 million, which Miller signs.
-
As for theories, I drew up a couple charts today. To summarize, in the last 45 games of last season Stafford had a greater number of shots inside 12ft and scored 5 of his 14 goals during that period from that distance. This year, with far fewer shots from 4-12ft, he has no goals from that distance. As for linemates. Don't know why the Ennis and Foligno line didn't work this year. Drew played very well with Gerbe last season on a plus/minus basis, but the Sabres didn't use the pair much this season.
-
GAME DISCUSSION THREAD GDT: Buffalo vs Ottawa (4/5/2013, 7:05pm)
rakish replied to Corp000085's topic in Archive
I'm hoping they give Leggio a cup of coffee in the next couple weeks -
I did some math last week. I wanted to see who got the toughtest minutes. I calculated the average even strength power play time by opposing forwards. So for example, if OV gets 4 min PP time a game, Backstrom 2 min, and Ward 1 min, playing against those three, your time would be 7. The interesting thing for me that came from this was Regehr's numbers. At home, where the Sabres can better control matchups, he was near the top at 5.95, but he led the team when on the road at 6.47. To me this means that the Sabres thought he should play against OV, but the Capitals thought that OV should be matched up with Regehr even more. I don't blame this on Regehr, I think he's still a solid 3rd pair and I never felt like he wasn't trying. I think the problem was that the Sabres thought he was their best guy while other teams were exploiting that matchup
-
thanks thesportsbuff. It's less exploitable than I had understood, since the Sabres would need to keep both part of the payment to Stafford and part of the cap hit.
-
question about CBA and trades. As I understand it, with the last CBA, the strategy was to weight contract payment forward, for example Sekera. The structure of the contract allows him, two years in to the contract, to count for a lot of cap space but cost little in cash, highly valuable to a team trying to save money. Then with the new CBA, they dispensed with that, and any contract and cap hit can be moved independently. Now Stafford can be traded with the Sabres retaining payment of his contract, only transferring the cap hit. Do I got this right?
-
that's interesting inkman, my perception was wrong, thanks everyone
-
Amerks watchers. My perception is that they got much better when the NHL players left. Is this a true perception? What do you attribute it to?
-
The team is minus 14 in goals, let's compare that to a team positioned in the standings where I think they should be, Ottawa, which is plus 6, so in a comparison with Ottawa, we are talking a problem of 20 goals.. The Sabres are a disaster on the power play, they are plus 6, Ottawa is plus 16 on the power play, which isn't great, Philadelphia is plus 24. The Sabres are minus 18 on the PK, not disastrous, but not great. Ottawa is minus 10 on the PK, which is great, not Boston great, but great. So to Ottawa we've lost 10 goals on the PP, and 8 on the PK, for a total of 18 goals. I believe the effectiveness of the power play and the penalty kill come from scheme. I watched the Islanders, who are plus 23 on the PP, the other night. Brad Boyes makes this sweet pass to Molson who puts it in the net. Why can't we get guys like Brad Boyes? This leads me to believe the problem is administrative. As discussed in another thread, when the other teams PP unit plays, for forwards, it's Stafford and Ennis that get the most ice time. I believe Ott, not with Ennis, on the ice against the other teams best offensive players would be something you should choose to do. This leads me to believe the problem is administrative. I believe creating a narrative that it's character flaws of the key players is over-reaching the data we have as analysts.
-
Boyes, for point 2. Don't have a third line center? Yes, very true. That Ott and Hecht don't play against Crosby and Stamkos? True as well, but that seems to be the choice of the Sabres. While Ennis and Stafford lead among forwards, all the veteran forwards are relatively bunched together as to ice time against the PP unit, so it doesn't look like either team really cares. The major difference between home and road is that the the opponent, when they are home, won't put their PP unit out as much against Regier, Hecht, Kaleta, and Ellis. And conversely, the Sabres try to shelter the kids, so they don't see the opposing PP unit as much at home. But I would like to defend Ott and Hecht for a moment. If you pull apart Ott's plus minus numbers, he has played 151 (about 2 1/2 games) even minutes with Hecht, they are plus 7 together, with no goals against on ice. My problem with the Sabres is that they don't know this, because instead of playing Ott with Hecht, they moved Ott to Ennis and Gerbe's line, which will fail. (It needs to be Ennis Gerbe Stafford) If you look at even strength Goals Against on Ice/60, both Ott and Hecht have excellent numbers, they're each on ice for about 1.3 goals per 60 minutes of ice time. Isn't that good? Isn't this what you had hoped for with Ott and Hecht? They are on the ice with the same defense everyone else plays with, yet no one is scoring on them. They give up about half the goals/60 as the power play unit, and the power play unit has an extra player. I think as I study ice time against opposing PP unit, I will find that the Sabres do very little line matching compared to other teams, (but I haven't run the numbers yet) but I think it's a philosophy rather than an indictment of Ott and Hecht, who, if you are chatting with someone in the organization, please mention they are plus 7 together.
-
What's my straw man?
-
X, some of those you can get now, the distance of each shot is tracked, so shots from point is available. Shifts without shot against is findable in the Play-By-Play with a little code. What I'm looking for is chances? Regier mentioned on the radio some chances stats, anybody know where they are? I mistrust a lot of things about Corsi. I believe that when players understand they are being judged by the number of shots taken, they take shots that have no chance of success. I believe this is true of Stafford. Second, I don't trust stats that can't be reversed. I'm told Miller is good because he has a low goals against per shot, but then am told that Ennis must be traded because he has a high goals per shot, that his shooting percentage will regress to the mean. Third, again, is Ott playing poorly? Is Stafford playing well? The plus minus has some anomalies, but for me far more relevant than Corsi. Then again, at least Corsi people aren't heighters
-
I don't believe Corsi numbers matter. I believe that Ott is playing very well, and Stafford not so much, but I think a believer in Corsi numbers will say the opposite. The math I've been working on is the amount of PP and PK time your opponents get. It's a work in progress since the important number is comparing home numbers to road numbers. Turns out Regher plays against forwards with most power play time, followed by, you guessed it, Stafford and Ennis. The home/road numbers will tell me if the Sabres are putting Ennis out when Crosby comes out, or the Penguins are sending Crosby out when they see Ennis. As you would expect, the Hodgson/Vanek, Pom line get the defensemen with the most PK time.
-
Tonight will be remembered as when the run began It actually turned around a few games ago Sometimes I am wrong
-
prescient
-
Certainly not a good contract, but to Eleven's point, we watch and believe that he's not trying, but you look at the stats, and, for the most part, he's on the ice for Sabre's goals, and he's not on the ice for other teams' goals. I would think that anyone trying can play in the defensive zone, and am not sure why Stafford's numbers aren't a whole lot worse. Just a disconnect I'm trying to figure out, not a defense of Stafford's floating, lack of scoring, or contract.
-
I hate watching Stafford, but his numbers are always better than what you might think, and it's gone on too long for me to attribute to luck. This year, his plus/minus with Hodgson is appalling (minus 6 in even time 24 minutes together, nothing on the PP). If you take either player's playing time away from the other, each player's stats are much better. Anybody have any theories? Last year Stafford's plus/minus numbers were great with Gerbe, Ennis, and Foligno. This year they tried the Stafford with Ennis and Foligno, but never really tried the Stafford/Gerbe pairing again this year. (Gerbe's historical great pairings have mostly left: Gaustad, Boyes) If this chart doesn't render, I'll try another method <table><tr><td>Teammate</td><td>Plus-Minus</td><td>Goals</td><td>GA</td><td>Time</td><td>PK</td><td>PP</td><td>Even</td></tr> <tr><td>26</td><td>-2</td><td>3</td><td>2</td><td>26</td><td>1</td><td>10</td><td>14</td></tr> <tr><td>29</td><td>0</td><td>3</td><td>0</td><td>21</td><td>1</td><td>15</td><td>4</td></tr> <tr><td>19</td><td>-6</td><td>0</td><td>6</td><td>45</td><td>0</td><td>19</td><td>24</td></tr> <tr><td>9</td><td>1</td><td>3</td><td>6</td><td>124</td><td>25</td><td>14</td><td>84</td></tr> <tr><td>42</td><td>-1</td><td>0</td><td>1</td><td>24</td><td>0</td><td>4</td><td>19</td></tr> <tr><td>82</td><td>-3</td><td>5</td><td>8</td><td>165</td><td>0</td><td>8</td><td>156</td></tr> <tr><td>63</td><td>2</td><td>11</td><td>6</td><td>225</td><td>1</td><td>19</td><td>204</td></tr> <tr><td>55</td><td>-1</td><td>2</td><td>4</td><td>50</td><td>4</td><td>0</td><td>46</td></tr> <tr><td>32</td><td>0</td><td>0</td><td>0</td><td>5</td><td>0</td><td>0</td><td>5</td></tr> <tr><td>36</td><td>0</td><td>0</td><td>0</td><td>4</td><td>0</td><td>0</td><td>3</td></tr> <tr><td>25</td><td>0</td><td>2</td><td>2</td><td>41</td><td>0</td><td>5</td><td>35</td></tr> <tr><td>8</td><td>0</td><td>0</td><td>0</td><td>4</td><td>0</td><td>0</td><td>4</td></tr> <tr><td>37</td><td>0</td><td>0</td><td>0</td><td>1</td><td>0</td><td>0</td><td>0</td></tr> <tr><td>Total</td><td>-6</td><td>13</td><td>22</td><td>395</td><td>35</td><td>42</td><td>317</td></tr> </table> Ok, the chart didn't render, I'll try this Teammate Plus-Minus Goals GA Time PK PP Even 26 -2 3 2 26 1 10 14 29 0 3 0 21 1 15 4 19 -6 0 6 45 0 19 24 9 1 3 6 124 25 14 84 42 -1 0 1 24 0 4 19 82 -3 5 8 165 0 8 156 63 2 11 6 225 1 19 204 55 -1 2 4 50 4 0 46 32 0 0 0 5 0 0 5 36 0 0 0 4 0 0 3 25 0 2 2 41 0 5 35 8 0 0 0 4 0 0 4 37 0 0 0 1 0 0 0 Total -6 13 22 395 35 42 317 Almost, here's another try Teammate Plus-Minus Goals GA Time PK PP Even 26 -2 3 2 26 1 10 14 29 0 3 0 21 1 15 4 19 -6 0 6 45 0 19 24 9 1 3 6 124 25 14 84 42 -1 0 1 24 0 4 19 82 -3 5 8 165 0 8 156 63 2 11 6 225 1 19 204 55 -1 2 4 50 4 0 46 32 0 0 0 5 0 0 5 36 0 0 0 4 0 0 3 25 0 2 2 41 0 5 35 8 0 0 0 4 0 0 4 37 0 0 0 1 0 0 0 Total -6 13 22 395 35 42 317 Screw it, the last one gets the point across
-
Ryan O'Reilly - Get Him At All Costs - Who Do You Trade
rakish replied to CallawaySabres's topic in Archive
I have two issues with trading for O'Reilly First, where is he going to play? Last year he played with Landeskog, think he wants to play on the Sabres third line? So solving the problem of defensive zone starts doesn't work, because if you have him (with Vanek and Pom) not getting offensive zone starts, that doesn't help Vanek. Second, I pulled apart his plus minus numbers from last year. Overall he was -1, his linemate was plus 20. Is this not a problem? Turns out together in 1057 even strength minutes, they were plus 9. Landeskog, in 206 even strength minutes without O'Reilly was plus 11. And O'Reilly, without Landeskog, was minus 10 in 244 even strength minutes. -
I did the math a couple games ago, Hodgson without Vanek, 63 minutes (about 30 even, 15 pp, 15 pk), Hodgson was a minus 7 with 4 PK goals against.
