-
Posts
1,470 -
Joined
-
Last visited
Content Type
Profiles
Forums
Events
Everything posted by rakish
-

Sabres Statistics: Stafford's Career Year
rakish replied to Johnny DangerFace's topic in The Aud Club
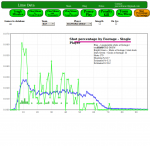
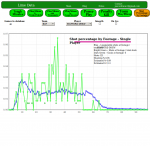
First: Drew Stafford is effective when he gets to the net. Lets first look at 2011-2012. You guys are all focused on the shooting percentage, but look at the chart, Drew got 6% of his shots from 9 feet, scored 3 goals. 5.5% from 10 ft, 2 goals, 5% from 11 ft, 5 goals, these numbers are well over the NHL average, the blue line. Of the 31 goals in 2011-2012, 15 were from 9 ft to 14 ft. If you take what he "should" have scored, the number is 19.2, but I don't take that seriously, it's just a number. Now lets look at last year. 1.6% of his shots from 9 feet, that's why he's not scoring anymore. The Corsi's will say, "He's getting his shots, he's just unlucky", No, last season he took the highest percentage of his shots from 34 feet. 34 freekin feet. Second: Stafford is effective with Ennis at center. He is bad with Hodgson at center. Ennis is terrible at wing. I'm not running the charts for you, but Nolan understands this ######, the last crew didn't. Yes he makes too much money, but not that much too much. -
As I told Josie when I thanked her, tunnel bear is amazing. I was worried it would be like youtube, and you wouldn't get each frame of video, but it looks wonderful on my relatively slow connection. I may keep tunnel bear because, if I remember right, Hockey Night in Canada streams to Canadians, and with tunnel bear, I'm Canadian too.
- 596 replies
-
- Olympics
- People on Skates
-
(and 5 more)
Tagged with:
-
I have not seen it
-
There's an audio clip of Hamilton interviewing Omark from the past week at WGR, probably still in the archive. I think it's worth a listen.
-
To me it indicates Hodgson is on the market. He has 2 empty net goals so far, and the Sabres haven't seen many empty nets. I've been looking at charts regarding zone starts. Maybe this chart is wrong, because it indicates that in Teddy's first game, he got all defensive zone starts.
-
I know I didn't type Pomminsteen, on this same subject, I also made charts for each player as to who he plays against, named X after Mr Bennedict, http://www.limedata.us/9.php
-
I dont believe this at all. I also would like to know where you got the info to compile that. check out my website, http://www.limedata.us/1.php it's last years charts. the chart shows the 5-5 time of the average power play time of your opponent forwards (the Y), and the average PK time for your opponent defenseman(the X). If you look at Buffalo, Regehr, in 5-5 time, saw the highest average PP time by opponents, Pom second, Sekera third. If you look along the X axis Pom, Hodgson, and Vanek saw the defensemen who most played the PK The size of the circle, along with the color, indicates plusminus
-
Most teams play their top line center against the opponents top line center. Exceptions I found last year were Colorado and Toronto. I have not made my charts this year to answer about this year. My theory on this is that it really screws up your salary structure if you play third line to first line. A good example last year was Grabovski being undervalued because he was on the third line playing against first liners. Additionally, Kadri gets a nice contract because he an Lupel face easy competition But you are not alone in believing this, Dark 4 will be by soon to call me nuts.
-
remember that this is last years work, so a lot of these guys like Hertl and Tarasenko have moved from the bottom list to the top chart
-
I haven't really looked at these issues in a year, but my memory is I looked at the Euro question and there was a big Jan/Dec differential in every country I looked at except Norway (I think), and there the big differential was Sept/Oct. The problem is you get past the hockey playing countries and there's not enough data. The August picks are about 190, looking at the picks, Crosby won't skew the data, because he doesn't play that many games a year, which is the problem with using games as the valuation. I've never been bothered by the 8.1 for August, because it's similar to the Sept(18.9) and October, they're just picked a year earlier. I think you are right that the older picks hit more, and in my current research Detroit is finding a lot of 20 year olds that someone like Regier would pass on looking for Alpha.
-
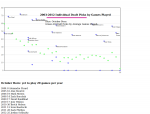
1. If you look at the chart, the August pick plays about 8.1 games per year. 2. Been working on this some, I think there is more of a correlation between (late round and undrafted success stories) and the fourth quarter born. I hope to have something out within a week As to your first point, yeah, maybe there's some of that. Where we probably disagree is that I think there are more January born players in the CHL. A quick look at 2 teams (Halifax and Baie-Comeau) suggests this, but I haven't really looked at it. I haven't decided where I am with the Bennett/Reinhart question.
-
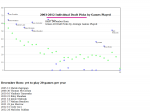
the x axis is the age of draft picks, starting at the left at 17.9 (for June draft), those are September born players. Each bar is one month. The y axis. The purple tells you the number of pics, so the picks increase each month from September to January. The scale is times 50, so for the players I looked at, about 250 were January picks. Then there's a big dropoff to the number of December picks, which came to about 100. The y axis green tells you the average games played, so the players picked at 17.9 play about 6 games each per season for the players that I looked at. The green bars hang out near 7 for September,Aug,July,June,May,Apr, then they decline a bit for March, Feb, and January. The green bars are higher, more games played per pick, for December, November, and October. What I'm arguing is that when people talk about this, they are often talking about the purple bars, it's interesting to them that the spread isn't consistent. What interests me is the green bars, that the games played in the NHL are also not consistent.
-
The January born 17 year old is overvalued because he plays fewer games per pick than the December born kid. I read this first in a magazine article by Gladwell, and he was trying to explain why there are so many more January born players. What interested me is who you want to pick, so I made this chart, that I've put out a few times here now. The purple bars are the number of picks by age (*50 I think), the green bars the number of games played
-
I haven't seen the freakanomics, but I believe Deaner/Lowen/Cobley are mixing two concepts that you guys are combining into one. Yes, many more Jan/Feb/March born players are drafted to play in the NHL, so there is more total talent in players born in that quadrant. As Derrico says, "the cycle continues through Junior," but it ends. The January born kid is overvalued at 17 You want to draft the Oct/Nov/Dec born player, because he will play more games per player, the breakdown is something like 9 games per Dec draft pick per year as opposed to 6 games per year for the January draft pick This doesn't really affect the 6'3" kid, but is critical for the 5'11" kid What Liger is talking about though is a different issue. Kids in Junior score about 50% more per year, at least those that are going to the NHL, so if you are comparing the ppg for Bennett vs Reinhart, you ought to consider the age of the kid. If you talk about rankings though, the NHL does do a good job of ranking by age, because the September born kid before the cut off and the kid born almost a year later, are valued correctly, and will each average 7 games per year
-
While I am on the Deluca/Ghost side of this issue, the win-loss without Hodgson isn't as good as you might think. He only played 5 games in December but the Sabres won 3, including the win in Boston when he barely played. NHL.com does this stat for you. Go to player stats, then use the splits tab sabres are 12-30 total In Hodgson's games, the sabres are 9-24 so they are 3-6 without him A few other part timers Weber 8-20 Ellis 5-5 Larsson 5-15 D'Agostini 7-9 McBain 10-20 McCormick 6-19 Tallinder 10-24 Rolston 4-16 Nolan 8-14
-
the last 75 on Buffalo
-
at 375 300 Buffalo
-
Previous balance 675 300 Buffalo
-
Bovada has St Louis -210 Buffalo +175 Is there an official place to find the line?
-
#Advancedstatsbitches 108 IQ's represent
-
300 Anaheim
-
previous balance 905 bet: San Jose 330
-
What line would it take for you to consider betting Buffalo Tuesday?
-
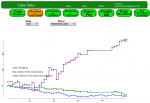
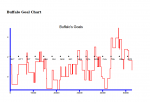
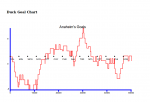
Previous balance 805 Anaheim 180 A little better explanation on the charts. If you've been paying attention from the beginning, I started with goal charts (and shot charts), but the problem was that they go in a straight line down, so it's hard to tell the current momentum. So these charts adjust a bit for each opponent, so by the end of the chart, they will come to near zero. For example, looking at Buffalo's chart. They first play Detroit. The Buffalo season goals are -20, Detroit, -4, then you subtract out the actual score, and what you end up with is that Buffalo should have lost that game by about goal, so at the start of the Detroit game, about 1 is added to the Buffalo goals. Since Buffalo lost that 2-1, they start the Ottawa game near zero, and since, based on +- goals per game, they should have lost to Ottawa by about 1 goal, they are given a goal to start that game. The idea is to get goal scoring momentum, but adjust it to the level of the opponent. Playing well against a good team should count more than playing well against a bad team. That leaves the y axis as something like standard deviation, and the x axis as seconds played since start of season.


