Randall Flagg
-
Posts
27,178 -
Joined
-
Last visited
Content Type
Profiles
Forums
Events
Everything posted by Randall Flagg
-
New club: Hockey Statistics -- Reference and Discussion
Randall Flagg replied to Marvin's topic in The Aud Club
I am dreadfully sorry for how long this is, I didn't mean it to get that way -
New club: Hockey Statistics -- Reference and Discussion
Randall Flagg replied to Marvin's topic in The Aud Club
I've spent a lot of time looking into this. Here's what I've found, in real time, as I've found it: It depends what kind of data we're talking about. When regression is performed for a model (like in RAPM charts or WAR stuff) I've seen the NHL's official html reports like this get scraped:http://www.nhl.com/scores/htmlreports/20172018/PL020672.HTM Because for those purposes, the main things you need to know are who was on the ice, what the score was, and when shifts start/end etc, and when events happen. The scraping code is available, you just have to dig into the references of a given model (they aren't shy about sharing what they do, it takes me hours to read through (without understanding a lot of) methods, conclusions etc). There are lots of big-data ways to combine the scraped data with other observations, whose natures I'm still looking into, like what will be discussed in the paragraph below. To give a generic answer to your first question - there are "RTSS employees" whose job it is to sit at each game and produce this stuff. We'll get into these guys with more detail later. The NHL also sources on-ice coordinates for shot events, which are the other main thing you're probably thinking of. From what I gather, the NHL isn't the only entity doing this, but when other people do analyses, they don't perpetually record every NHL game year after year, they eventually stop and write a paper with their results. For the guys you usually see here (McCurdy, Tierney, EvolvingWild etc) who create massive series of published papers on all this stuff, it appears that they generally use the NHL's data. One thing I'll say about this exploration I'm undergoing in real time - big data really does have its hands on everything, and I'm surprised at how deep and intricate this stuff goes. There are a lot of people way smarter than me who put stunning amounts of work into this stuff. I'm sifting through academic articles arguing about the impact of shot quality (implying they were using it to generate models then) from 2007. Apparently a data scientist named Ken Krzywicki was integral to the shot quality data generation in 2007? I could be picking up the context incorrectly though. I'm just kinda dumping more info here as I come across it. Apparently that Ken guy was frustrated at shot distance data being consistently under or over reported at certain venues back in 2009, and created a unique model for each arena that took this into account and allowed statistically meaningful comparisons based on the way the employees that year consistently reported. These employees are the "RTSS staff" whose job it is to do what you're basically asking about. He was successful, as far as statistical models go, at smoothing out these differences - before you could generate a model based on the RTSS staff's work, but its predictions didn't match the scoring results seen. A typical linear regression to isolate rink impacts on shot data was performed, and did its job, providing corrective factors for these tendencies. Resulting predictions matched the scoring results much better, being able to control for the "observer bias" of whoever was doing the work those years. Here's the paper: http://hockeyanalytics.com/Research_files/SQ-DistAdj-RS0809-Krzywicki.pdf I So, to the question of "well what if some people count stats differently than others" there are statistical methods that can get around observer bias and apparently have been in use at least since the Sabres last were winning playoff series. Here's a paper from a bunch of stats nerds that does zone entries - they wrote this for an analytics conference. http://www.hockeyanalytics.com/Research_files/Using Zone Entry Data To Separate Offensive, Neutral, And Defensive Zone Performance.pdf This would fall under the "individual project" category I mentioned above. Here's how they acquired data: "2 Data Collection and Assessment Each time a team advanced the puck into the offensive zone, the observers recorded a few key parameters: The time on the clock The player who sent the puck into the zone The method of entry (e.g. carrying the puck in with possession, dumping it into the zone and trying to recover it, or miscellaneous other entries such as shots on goal from the neutral zone) This data was then merged with the official play-by-play, breaking the game into a series of segments from one zone entry or offensive zone faceoff to the next. The number of shots (including those that miss the net) and goals produced in each offensive zone possession were extracted from the play-by-play. This permitted assessments of each player’s contributions with the puck; to additionally identify defensive and off-puck offensive contributions, the list of players on the ice at the time of each zone entry was obtained from the official shift charts. In this manner, 330 games were tracked, covering a full season for the Flyers and Wild, a half-season for the Capitals and Sabres, and approximately 7-10 games for most other teams. For any manually-tracked data, it is important to assess the potential impact of scorer variability. Subjective assessments such as scoring chance counts can show major differences across scorers.[4] Since the puck crossing the blue line is a discrete, objective event, zone entry counts might be expected to be less problematic, but the scorers do still have a few decisions to make. The difference between carrying the puck in and dumping it in is usually clear, but the line between a pass with possession and a dump-in is occasionally tricky, as are some miscellaneous entries (e.g. when a player carries the puck back into his own zone and then turns it over). Additionally, since the goal is to assess offensive and defensive performance, plays where the offense dumps the puck in and goes for a line change without making any attempt to recover the puck were excluded, which introduces a bit more subjectivity. Several games were tracked by multiple observers. Comparing zone entry data from those games permits assessment of the integrity of the data and the viability of comparisons across data sets. Correlation matrices are given in Figure 1, indicating how often observers agreed on a given entry (more than 85% of the time) and what the most common discrepancies were (nearly two-thirds were when one observer omitted an entry that another recorded).The only significant scorer bias appears to be in the number of entries omitted; the distribution of entry types was consistent across observers and there was no apparent tendency for an observer to record his favorite team differently from what a fan of the opponent would record. Dump-and-change plays were explicitly tracked for Capitals games and were typically accompanied by having four offensive players leave the ice within five seconds. Therefore, subjectivity around omissions could be removed by recording every dump-in and algorithmically removing the dump-and-change plays from the NHL shift chart." That's how these particular guys for this particular paper tried to account for their own bias in their data. Here is a scraper that you can use on the RTSS reports if you wanted to: https://pythonhosted.org/nhlscrapi/ Here's some more work on adjusting for unreliability in RTSS event recording, from 2012-2013: http://statsportsconsulting.com/main/wp-content/uploads/Schuckers_Macdonald_RinkEffects_Final.pdf Here's how one man makes heat maps from zone charts he makes from NHL data: https://blog.icydata.hockey/2018/07/08/create-heatmaps-in-php-and-other-languages/ I just found an NHL JSON for a typical game. http://statsapi.web.nhl.com/api/v1/game/2015030411/feed/live It has the event location data!!! finally! I spent like two hours trying to find an example of how I could get a shot location from NHL data. for example, the 11th event recorded in this Sharks/Penguins game took place at coordinate (-69.0 (nice), 22) (I don't know the details of their mesh coordinates off hand, center ice is probably (0,0) with the rink going left-right). It was a wrist shot on Martin Jones by Matt Cullen, saved. THIS is the information, recorded by the RTSS guys whose job it is to do this, that gets turned into most of the charts we see. I dunno if there are other sources that track these things - other people will clearly do their own tracking for smaller projects like posted above, but I wouldn't be surprised if most of the big ones we see use this stuff. moneypuck's about section gives options to download data going back to 2008-09 if you wanted to make this stuff yourself from scratch. There are MASSIVE amounts of data here. Here's a random guy who did a bunch of work so that you can generate a shot chart of any game going back almost a decade, from these game JSON scripts or whatever theyre called. https://public.tableau.com/profile/icydata#!/vizhome/ShotChart_2/ShotChart So, now back to the question of who these people are. It's almost impossible to find details. First, people still regularly have problems with the job they do - reports of sketchy data appear common, which goes to the heart of your question. "castles made on sand" was a phrase used back in 2009, and it appears that I'd be lying to say it still isn't a concern now. It's possible @TrueBlueGED (who I think has been to some of these conferences) can provide details on how big the problem is, and what the community wants to do, or how it feels, about it. But yeah, there's no information for how many people generate this data, if they cross check each other, etc. Enough errors have been found in event logs, and the existence of the observer bias in the first place, appears to indicate that the NHL has a lot of room for improvement in this stuff. Now that I think about it, this is probably the major driving force for getting puck and player tracking chips developed - at the very least, coordinate information will become impeccable, and outright event classification much easier. I wish I had more to offer on this end, since it's basically what your question was. AHA, here's an article with some good info. https://www.nhl.com/news/off-ice-officials-are-a-fourth-team-at-every-game/c-38840 HITS is apparently what RTSS was.This is an old article, I'm sure some things have changed. I don't think shot location data was available when this article was written, that's clearly been incorporated somehow. Ultimately, it appears that caution should be applied with any stat or chart you see, because enough problems have been raised with this data that you can't assume it's all good. At the same time, I'm not sure I see reason to believe entire charts with thousands of minutes of sample size on them are useless or would be inverted with "more correct" data. These are people whose job it is to do this, after all, they aren't monkeys at typewriters or random number generators. I don't have a firm handle on what mistakes get made and how often they're made. Perhaps it's less important to note that Risto has exactly 2.3 zone exit passes per blah blah blah, and more important to look for general trends in lots of metrics, and absorb as much information (both numbers and on film) as you can to make judgments (which is a personal commandment of mine - i still cringe that y'all assume I'm just a stat head - I don't think I've even posted a RAPM chart outside of the post in which I explain how theyre made! Any chart, stat, or single video clip is pretty useless in hockey analysis, the best you can do is combine together as much information as time allows) Stat collecting appears to be about as messy and human as you'd expect it to be. Certainly not useless like one extreme would claim, and certainly not gospel like the other would. We have the info we have, it's not perfect, but it's better than nothing, and should use it responsibly. I trust the analysis done with the data more than I trust the data itself - these guys do a lot of work, and will tell you in mind-numbing detail what they did every step of the way and why! -
Tampa would not trade us Anthony straight up, but even if he never grew another inch from what he was, it would be better to acquire him than someone like Tyler Johnson. I'm not even sure TJ would give us better right away, but he'd fall out of favor before Risto turned 27, and he's basically a known commodity with next to zero chance to take another step. I'd rather take a chance on the guy that a good scout thinks can be special, and risk him not getting there. The reason I zoom in on Cirelli (who looked the part next to guys like Stone at worlds as well) is because it's not even a chance or a risk - he could NOT become special and still be more useful three years from now than a Tyler Johnson would be. Maybe it's not Cirelli, maybe they can find a different player like that, but he's the one that gives me the same feels that Point did last year, and the way that went gave me renewed confidence in what I'm seeing down there.
-
You keep saying very sheltered. The only centers on Buffalo or Tampa that had a higher percentage of defensive zone starts are Larry, Zemgus, Sobotka, Paquette. He had more than any of Stamkos, Point, Eichel, Mitts etc. Just looking at random eastern conference teams, the forwards he saw the most are Domi from Montreal, Huberdeau from Florida, Ovechkin from Washington, Matthews' line from Toronto (he and Johnsson are the most common opponents of Cirelli from Tampa, and played on the same line), the Couturier-Giroux line from Philly. He drew the ROR line in his two Blues matchups based on most common opponents. He drew Toronto's top defense pair more than any other Toronto defense pair. Played against Dahlin more than any other Sabre D, Kessel more than any other Pen forward. In what way is this sheltered? He did this all while every modicum of offensive opportunity was given to Stamkos' line and Kucherov's line, while they were off chasing records, and still at 21 while being a PK staple and 58% dzone starts put up a ~20 goal, ~40 point season. He has a lot more to grow, and a lot more to give already even if he didn't grow, by getting out of the offensive shadow of TWO superstar lines.
-
Both he and Point are great in each direction of the ice. He was their best penalty killing forward and scored five shorties while doing it.
-
Cirelli is not high-risk at all. He's already an outstanding hockey player, and when the depth chart above him isn't clogged by two top-10-15 centers, his GAP will show it. I would add significant assets to Risto to facilitate a move for Cirelli, and I hope Botts doesn't just look at a stat sheet and see "man I can't trade Risto for a 39 point kid." Because his ability and drive are wonderful. His film shows it.
-
That does seem surprising. I've basically been assuming that I'll never see this guy outside of a couple preseason games
-
New club: Hockey Statistics -- Reference and Discussion
Randall Flagg replied to Marvin's topic in The Aud Club
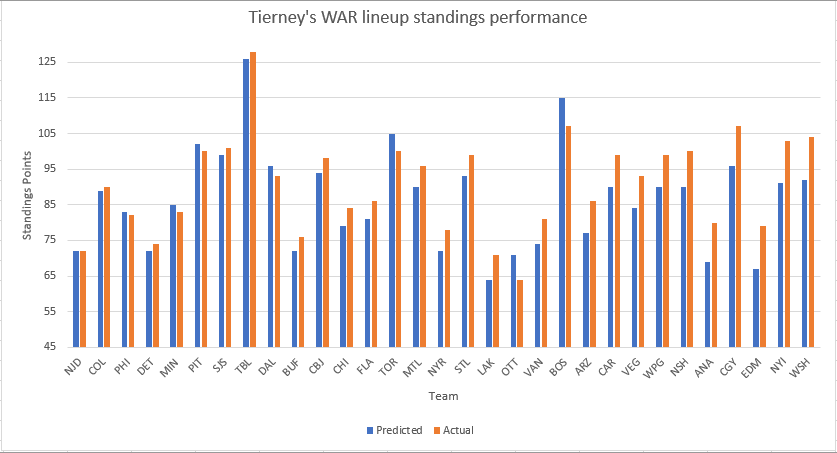
So Sean Tierney (a creator of many charts that get posted here and everywhere) has this pretty neat lineup creator tool that uses a projected 82-game WAR (data and WAR information is from EvolvingWild https://evolving-hockey.com/ (check the references section for weeks' worth of reading on these models) with WAR-specific stuff here: https://hockey-graphs.com/2019/01/17/wins-above-replacement-the-process-part-2/). Since WAR is ultimately an attempt to combine everything a player does into a single number (with obvious constraints on the number of variables and their inherent uncertainties and yaddah yaddah) you can theoretically have a somewhat decent guess at how a team would fair, and it makes the lineup creator tool fun. Here's the tool: https://docs.google.com/spreadsheets/d/1hkm-5QqNEQKULy4Bp8VTQHJoQlcehSgx1lZKMxQ4Uog/edit#gid=276138252 I decided to see how well the WAR creator replicates last season's standings. I used dailyfaceoff to get most common lines/pairings used by teams, and hockey reference to get time-on-ice information, and Tierney's time on ice adjustment was sort of averaged from the combinations of players made from this information. Obviously, this is incredibly patched together, because it's just 12 forward spots and 6 d spots and so injuries and thus injury replacements are neglected - it's a tool to get total WAR numbers for a full season of just these 18 skaters and 2 goalies, after all. But still, I was curious to see how it did. Hopefully using raw time on ice was okay since I think the individual WAR number for each player takes into account their power play or PK time. Anyway, after doing all of this with each team, these are the results: The difference between the model and reality increases as you move left to right. I would say that this did a bit better than I expected - for 2/3 of the NHL, it was within plus or minus 3 wins. The worst performance was six wins off. Another interesting trend - it tends to undervalue things, only seven of the thirty one teams were calculated to finish higher than they actually did. 23 teams did better than the model thought, and one was bang on. There are probably infinite confounding factors for this phenomenon, maybe including the fact that sometimes injury replacements can be better than guys pushed out of the bottom of the lineup? I tended to stick players in with the most games played, and always players that started the year with the team, so it misses the fact that teams often bolster their lineups at the trade deadline. This is why it over-predicts Ottawa - both Stone and Duchene were present in their lineup, which matches the fact that they closed the year with just seven wins in their last 24 games, after 22 in their first 58 (a decline in win percentage of 8%). Interesting is that, of the large gaps to the right, the model is always conservative - it does its over-predicting when it does a better job of predicting, not when it's way off. I don't see a trend in the teams there either - Washington, Islanders, Oilers, Flames, Ducks, Nashville, Winnipeg, Vegas. Some good, some bad. None of the elite teams. FWIW, all playoff teams in that group lost in the first round except the Islanders, who were swept in round 2. Perhaps the model saw them for what they were. Or perhaps it's completely random! Either way, if you come across or want to use the model, presuming that you'll use it to see what the Sabres or another team might look like for next year, this gives you some idea of its performance. It would never claim to be elite at this, because of aforementioned drawbacks. I'm not sure I could have done better writing out standings before the season started. In fact, I might try that this year - make my own detailed standings predictions, write them down, and then do this with the WAR for that season afterwards to see what does a better job. Because this was fun! Here are the NHL Standings based on the WAR lineup creator: 1.)TBL (-) 2.)BOS (-) 3.)TOR (+5) 4.)PIT (+5) 5.)SJS (+2) 6.)DAL (+10) 7.)CGY (-3) 8.)CBJ (+6) 9.)STL (+2) 10.)WSH (-5) 11.)NYI (-5) 12.)MTL (+3) 13.)CAR (-1) 14.)WPG (-1) 15.)NSH (-5) 16.)COL (+2) 17.)MIN (+5) 18.)VEG (-1) 19.)PHI (+4) 20.)FLA (-1) 21.)CHI (-) 22.)ARZ (-2) 23.)VAN (+1) 24.)NJD (+6) 25.)DET (+4) 26.)BUF (+2) 27.)NYR (-) 28.)OTT (+4) 29.)ANA (-4) 30.)EDM (-4) 31.)LAK (-1) It really only over-predicted Dallas, and it liked New Jersey better than they were by a lot (which is weird, because I didn't include Hall in their lineup...) This would have given us a first round of: Boston vs Toronto Pittsburgh vs NYI Washington vs CBJ Tampa vs Carolina St. Louis vs Winnipeg Calgary vs Vegas Dallas vs Nashville San Jose vs Colorado So in each conference in WAR world, we would have had 50% of the same playoff series, and then the other two teams would merely have swapped opponents in each case. Pretty spooky. I CERTAINLY wouldn't have been this successful predicting before the season, even if I knew everything about each player individually that I do now while being ignorant of any game or standings results. Now, there are a few differences in division winners by which these series play out (Pittsburgh was the division winner in WAR world, so NYI were a WC team). And Vegas actually finished worse than Minnesota here but got in because of the playoff format. Still, fun!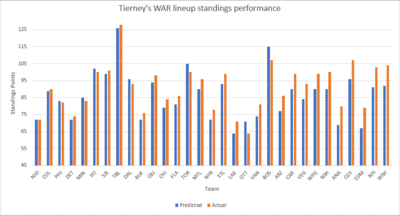
-
I vividly remember explaining to my girlfriend (who patiently waited without rolling her eyes) that Girgs and Grigs finally solved the center woes and would be integral to our first cup at last!
-
We've drafted 6 centers in the first round since 2012, all in the top half, most in the top ten. This includes the one we took this past draft, the one we took three drafts ago, Eichel in 2015, Sam in 2014, and the Gs in 2012. Of those (and overall), we have one player that can be described as a "decent or better NHL center" (Eichel) so I don't like building trades off of the assumption that THIS time we definitely have a top six center of the future. It wasn't either of the Gs (I'm sure we could find some horrifying lineups from this forum in 2012-2014 that we all drooled over), it wasn't Sam, and it might not be Mitts or Cozens, so if we trade for a winger, I hope it's because we really like the winger and have plans A through Z at center, and not because "Oh casey will be fiiiine at 2C, no doubt"
-
Sabres Trade Alex Nylander to Chicago for D Man Henri Jokiharju
Randall Flagg replied to Brawndo's topic in The Aud Club
What bugs you about it? And hey, one offseason transformed the outlook of the Browns. We could be one move away from being the same way. -
Ruotsalainen is going to be a tough one to nickname. Not biting on Ruotsy.
-
Overlooking the Defensive Contribution to Offense?
Randall Flagg replied to CallawaySabres's topic in The Aud Club
I'd prefer talking about this to the Risto-at-RW talk I've seen on twitter and hf -
Sabres Trade Alex Nylander to Chicago for D Man Henri Jokiharju
Randall Flagg replied to Brawndo's topic in The Aud Club
That would definitely improve the team! Johansson is by far the best player of the bunch, and Vesey is likely the second-best. Depends on Thompson's progression though. Safe to say Vlad is the worst of the four. -
Sabres Trade Alex Nylander to Chicago for D Man Henri Jokiharju
Randall Flagg replied to Brawndo's topic in The Aud Club
@triumph_communes Natural stat trick says Casey played 500 of his 825 5v5 minutes without Okposo. Statistics sucks so I'm far less familiar with the branch as a whole than almost any other branch of mathematics, but I'm pretty comfortable with the regression competently isolating him from Kyle. -
Sabres Trade Alex Nylander to Chicago for D Man Henri Jokiharju
Randall Flagg replied to Brawndo's topic in The Aud Club
He says he's really good friends with Laaksonen, they have the same hometown. And he knows 6K. (The goalie Ukko Pekka Luukkonen - no idea if i spelled that right) -
Sabres Trade Alex Nylander to Chicago for D Man Henri Jokiharju
Randall Flagg replied to Brawndo's topic in The Aud Club
This is foolish to glean from watching 20 clips from just two games...but IMO Jokiharju's ceiling is sky high. I was impressed as hell by what I saw, against the future stanley cup champions, from a 19 year old. It's summer so we're allowed to be hopeful. -
I honestly don't even really want Ehlers. I hope Jason finds a way to get something done with a Florida team
-
Sabres Trade Alex Nylander to Chicago for D Man Henri Jokiharju
Randall Flagg replied to Brawndo's topic in The Aud Club
Did anyone post the athletic article that does film breakdown of his first two NHL games? If not here it is: https://theathletic.com/573862/2018/10/07/video-session-breaking-down-henri-jokiharjus-impressive-game-shift-by-shift/ There are some nice video clips in there. @SwampD they show some defensive zone play against NHLers. -
I can probably think of examples that go both ways for me. I'd prefer JT Miller to Mike Hoffman for example. Hoffman can reasonably be a top line winger (maybe preferably the 3rd best player on that line but still) and when we talked Miller for Risto, lots of people said "2C sliding to 3C or wing"
-
In this example I agree with taking the winger, but not for the reason you state - nobody should ever assume that until they see it happening The only center we've been correct about this with in my entire fanhood was a guy that many people called borderline generational and first overall in any draft since Crosby, and even he has disappointed those expectations
-
Sabres Trade Alex Nylander to Chicago for D Man Henri Jokiharju
Randall Flagg replied to Brawndo's topic in The Aud Club
I think I need to take a step back here. I treat all skaters in an NHL sweater as pieces that directly affect the ultimate thing that matters more than anything else, certainly to me - NHL wins. Because prospect or vet, their successes and failures explicitly do this (affect the NHL game they're playing in) in the here and now, equally to each other. I don't change verbiage depending on the nature of the player when I'm trying to describe what is happening on the ice in relation to tonight's NHL game and this NHL season, because it serves no purpose except to delineate how we might proceed with said player going forward, which usually has nothing to do with the conversation at hand. This is different from saying that there might be a purpose to letting a player struggle for development. Which is different still from saying that there are multiple reasons NHL organizations do the things they do. And should certainly never imply that every choice the Cleveland Browns of the NHL make is correct - as the player submarines his NHL team while having his confidence eroded. These guys can be devastating on a team that knows how to use off-puck rovers-of-sorts. -
Sabres Trade Alex Nylander to Chicago for D Man Henri Jokiharju
Randall Flagg replied to Brawndo's topic in The Aud Club
When's that? -
Sabres Trade Alex Nylander to Chicago for D Man Henri Jokiharju
Randall Flagg replied to Brawndo's topic in The Aud Club
I'm intrigued to see this, because his thing appears to be finding that soft spot for his teammates to get him the puck, and man oh man is that the entire point of Chicago's game. And I'm not convinced it's evidence of him not caring or trying just yet. But I'm happy with the trade either way. -
Sabres Trade Alex Nylander to Chicago for D Man Henri Jokiharju
Randall Flagg replied to Brawndo's topic in The Aud Club
I think that's my bad. ------------------------------------------------------------------------------------------- I'm tempted to watch a few blackhawks games tbh, I'm not sure if I have time now though, it might have to wait until next month